
Data Collecting, Analysis, Visualization, Example 1.
For this example of data anlysis and visualization imagine how it would be if you were a student and wanted to study somewhere in USA.
You would probably want to find the best place to study. You would check all those Universities like Harvard, MIT, Yale, Columbia, Princeton, John Hopkins, Duke, etc. at East Coast and Stanford, UC Berkley, Caltech, etc. at Weast Coast and maybe some others in the middle or in the south.
And you would probably found out that there are so many various parameters you should take under consideration while deciding where to study. You could even get a headache from all that unstructured data... But finally you would have found that most important parameter... And the most important would be... the weather, of course. After all, you don't want to spend a year (or more) in "too cold" or "too hot" climate, do you.
So now it's time analyze some data.
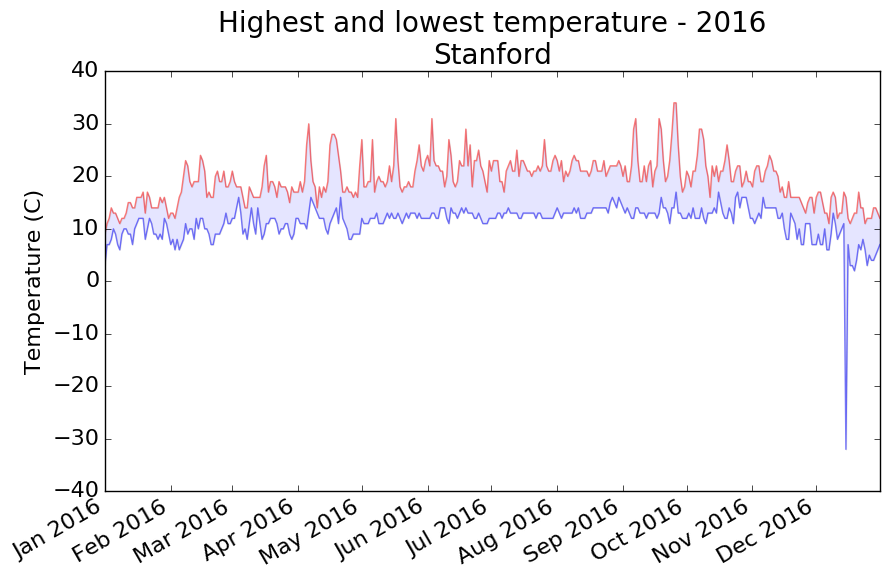
Knowing all you already know, you could take the data from, let's say: wunderground.com and check how does this weather look like in, for example, Boston/East Coast (Harvard, MIT, etc.) and San Francisco/West Coast (Stanford, UC Berkley, etc.).
And you could make some simple, but also awesome visualizations of that data showing the lowest and highest temperature in these cities in 2016 (or any other year you like, there is a lot of data at the site).
This kind of visualization make it much simpler to decide where to study, don't you think.
Here are two simple plots with data from the mentioned site. As you can see, it's usually warmer in California, but that one day in December 2016... What was it?

So, where would you go?
Oh, before you go there, you might also want to know a bit more about GDP of USA and other countries, so check the second example of data analysis and visualization.

And remember - analyze and visualize wherever you can and whenever it's needed.